Synthetic monitoring tools are a type of software used to simulate user interactions with a website or application to proactively monitor its performance and availability.
Discover top 10 Best Synthetic Monitoring Tools
Splunk
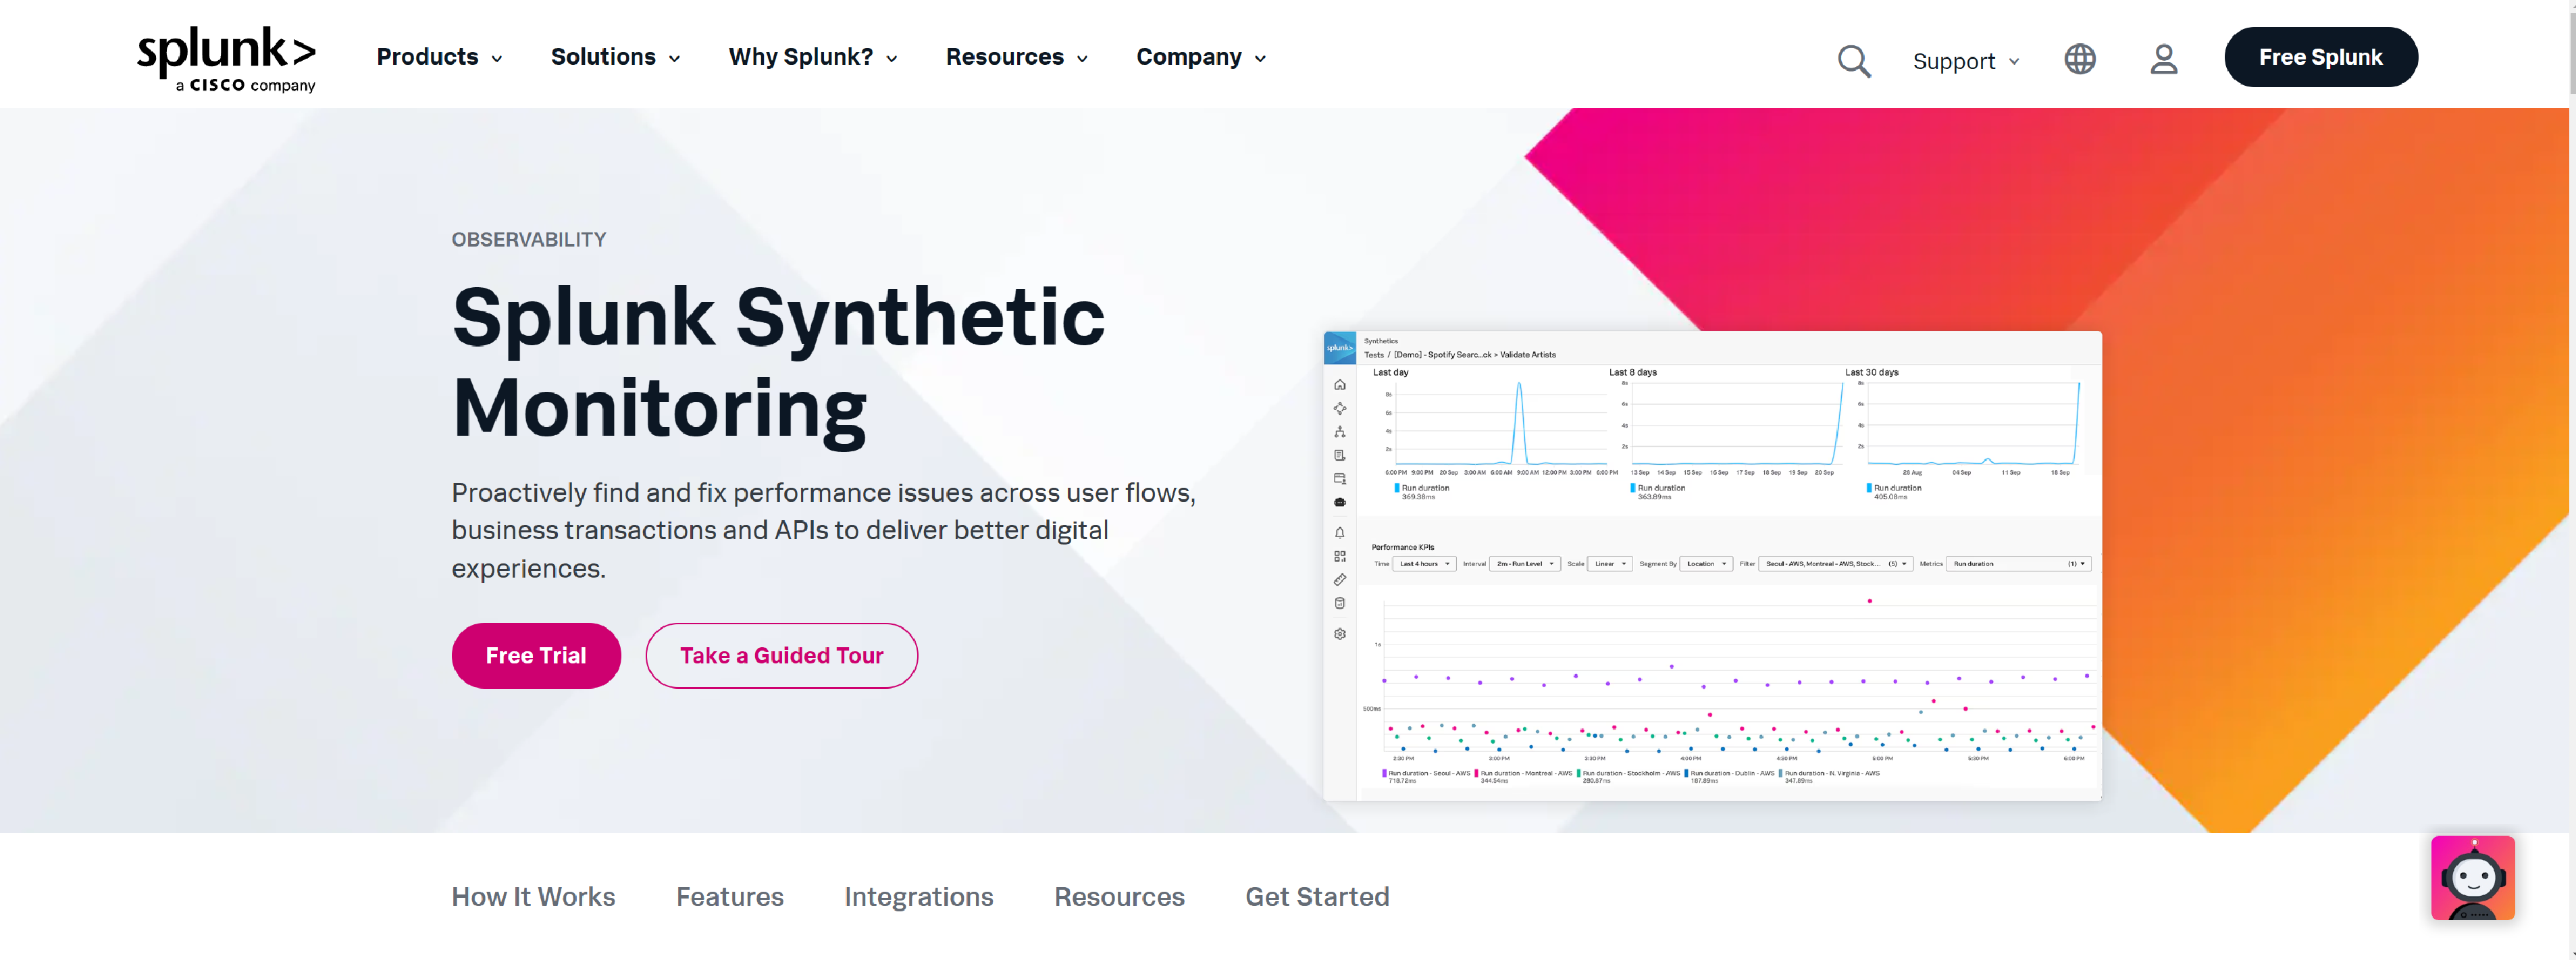
Splunk helps you proactively identify and resolve performance issues across user flows, business transactions, and APIs, ensuring improved digital experiences.
- Effortlessly measure, report, and build dashboards to track SLAs for availability and performance, along with your complete alert history
- Test and optimize page speed and functionality across all page resources, APIs, and third-party dependencies throughout your entire user flow
- Automatically evaluate builds based on performance budgets within your continuous integration/continuous delivery (CI/CD) pipelines
- Gain insights into how end users experience your website on both web and mobile platforms
- Track the journey of your data from front-end to back-end, understanding how backend services influence every synthetic test
- Benchmark your site’s performance against competitors and industry standards to prioritize necessary improvements
Smartbear
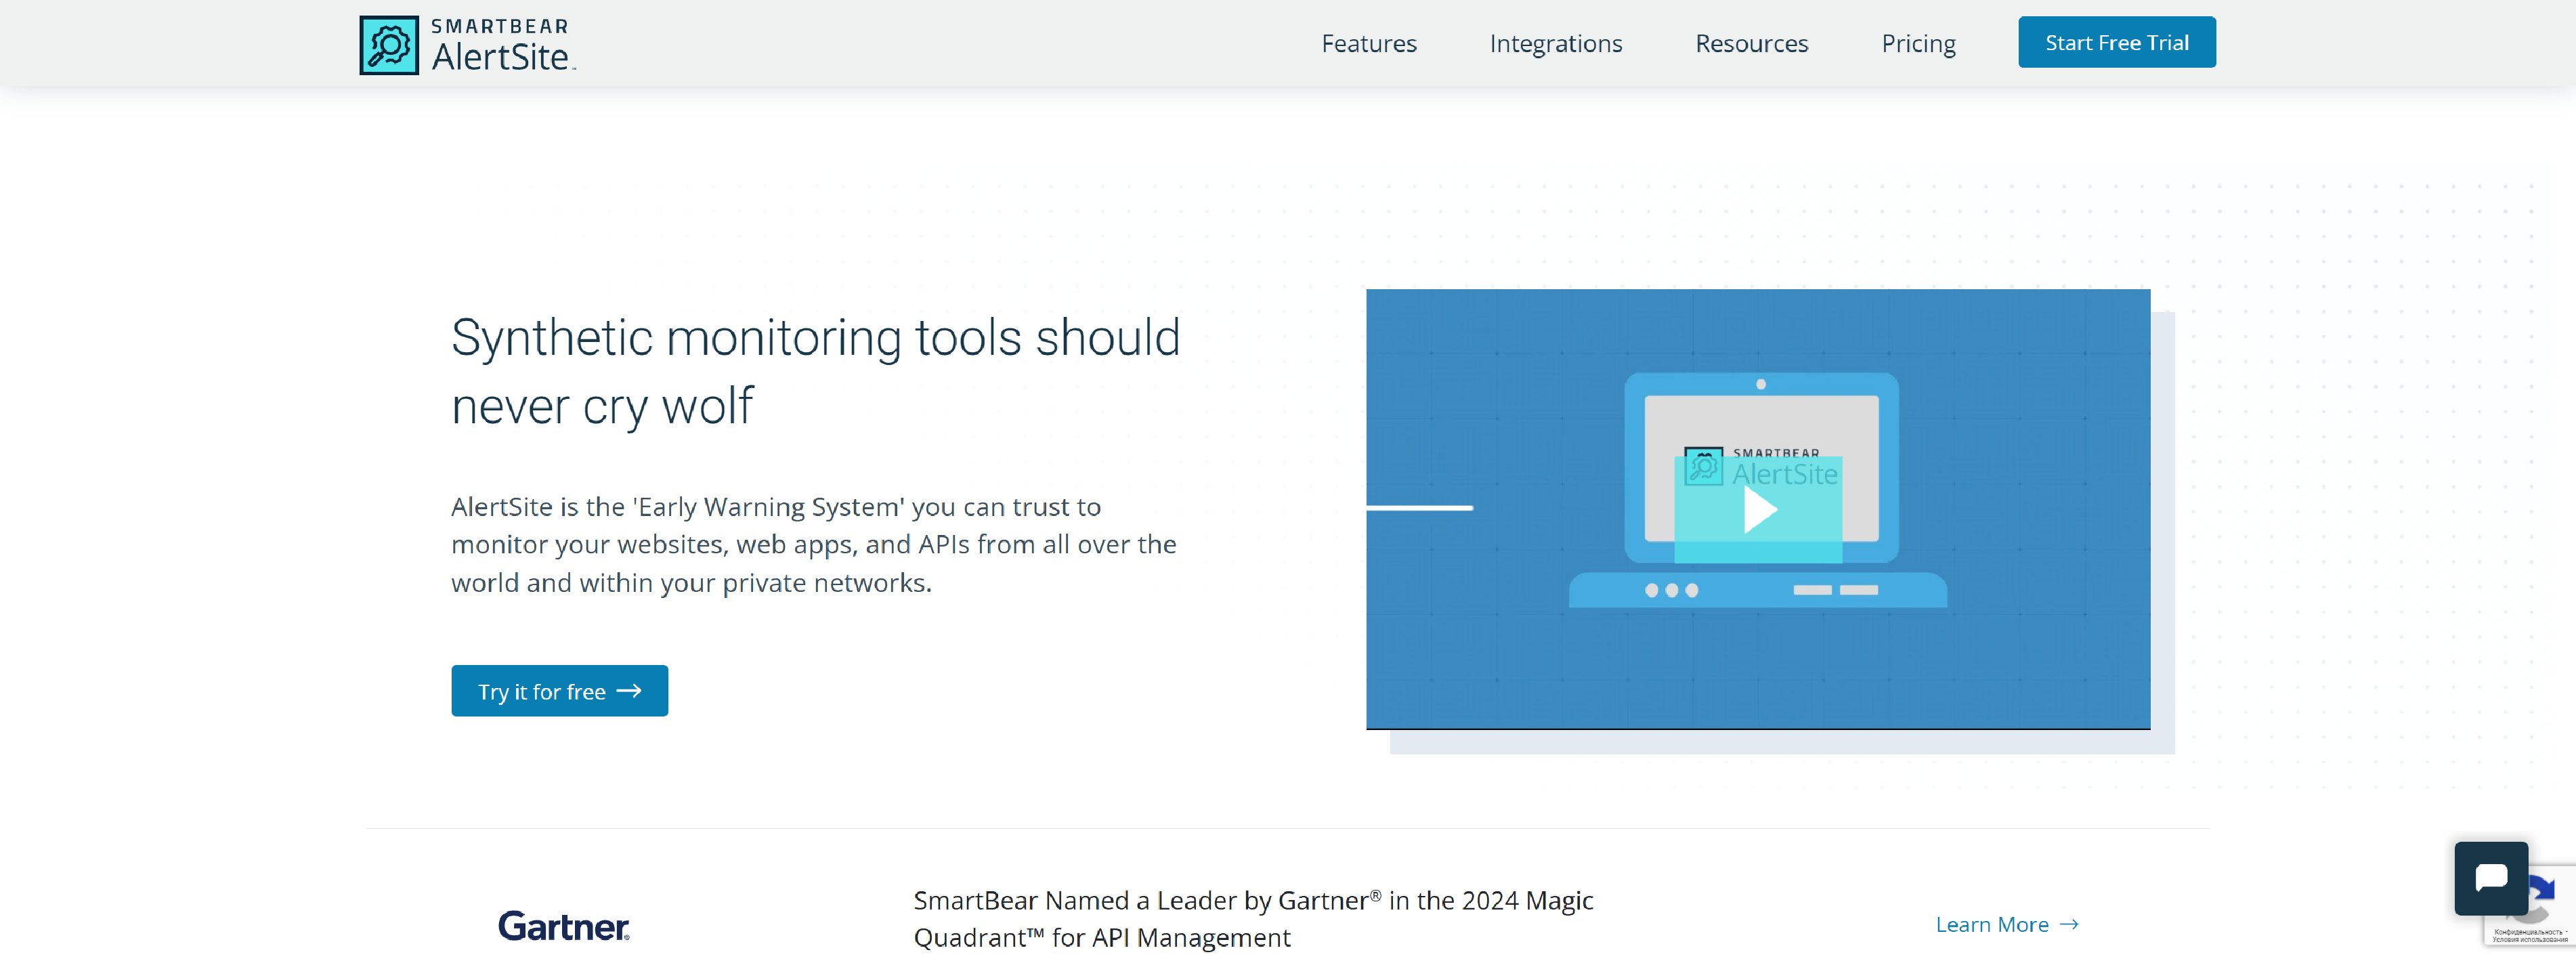
SmartBear’s AlertSite is the reliable ‘Early Warning System’ that monitors your websites, web apps, and APIs globally, as well as within your private networks.
- AlertSite goes beyond availability monitoring to detect performance anomalies and notify the right team members when issues arise
- AlertSite tracks and reports on SLA compliance to ensure your service standards are met
- Monitor mobile web apps and API performance to guarantee an exceptional experience for your end users
- With coverage across public and private clouds, AlertSite provides complete visibility into the health of your applications
- Easily monitor multi-step API transactions, validate payloads, and reduce MTTR – all without needing to write a single line of code
- Quickly resolve application performance issues by proactively monitoring availability, speed, and functionality
Catchpoint
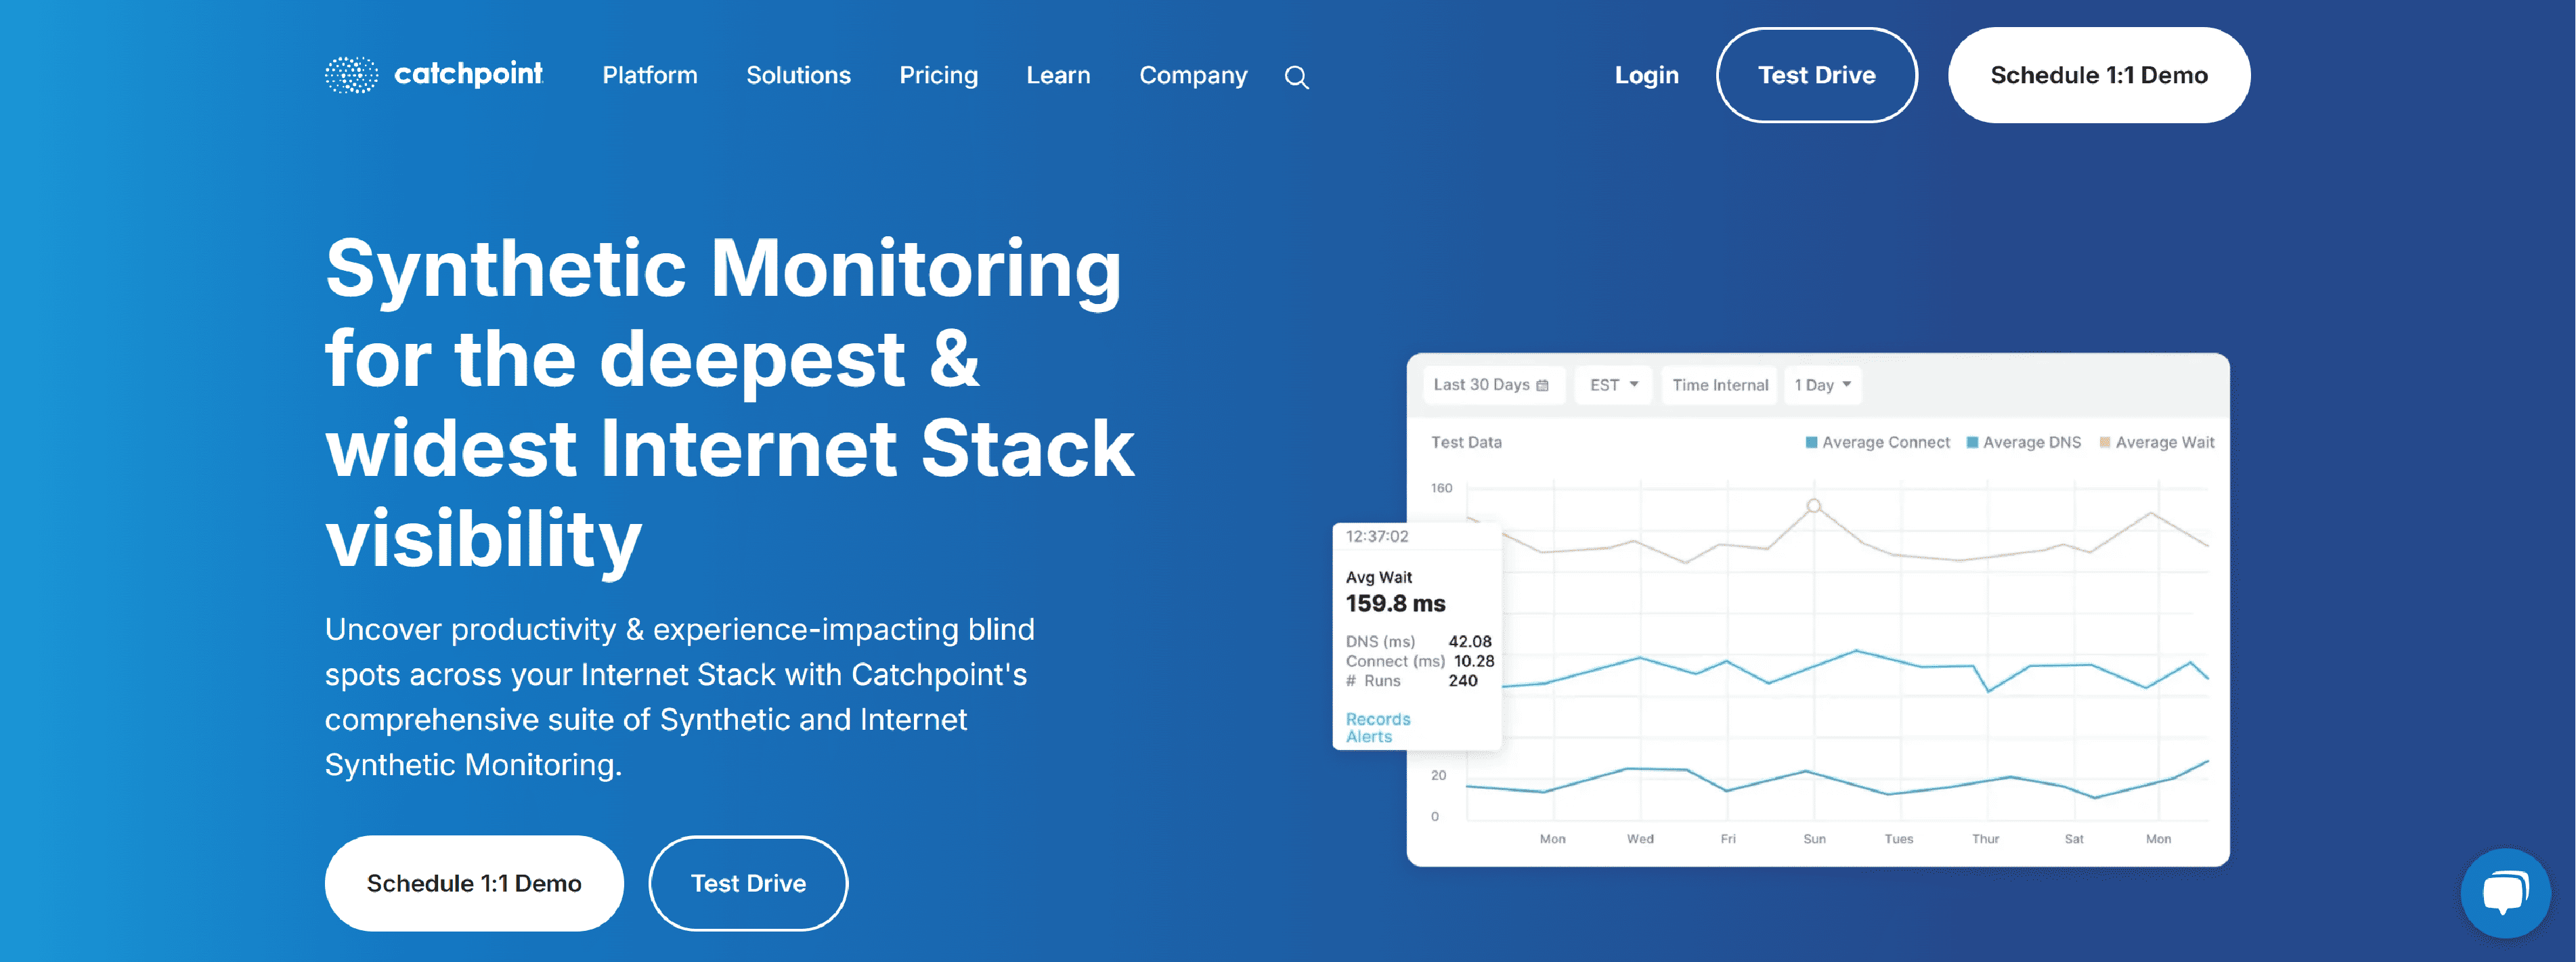
Identify productivity and experience gaps across your Internet stack with Catchpoint’s all-encompassing suite of Synthetic and Internet Synthetic Monitoring.
- Conduct proactive tests across every layer of the Internet Stack – starting from DNS resolution, through the network, to the web application front end, and even tracing through the entire application stack
- Gather telemetry from various connection types, from the edge to the backbone and all the way to the last mile or multi-access edge
- Measure the performance, reach, and reliability of your end user’s experience and the components that enable them
- Simulate chaos and failover scenarios to ensure the optimal Internet Stack is utilized in the right regions
- Maintain resilient user journeys with automated browser testing
- Run any of IPM’s default proactive monitors or create your own custom monitor.
- Diagnose whether an issue stems from your cloud infrastructure or cloud application, and take the necessary actions
- Enhance collaboration and reduce repair times by sending data or alerts to your existing tools, like PagerDuty, Slack, or other integrations
- Set maintenance windows and adjust your uptime or performance thresholds to prevent false alerts
Dynatrace
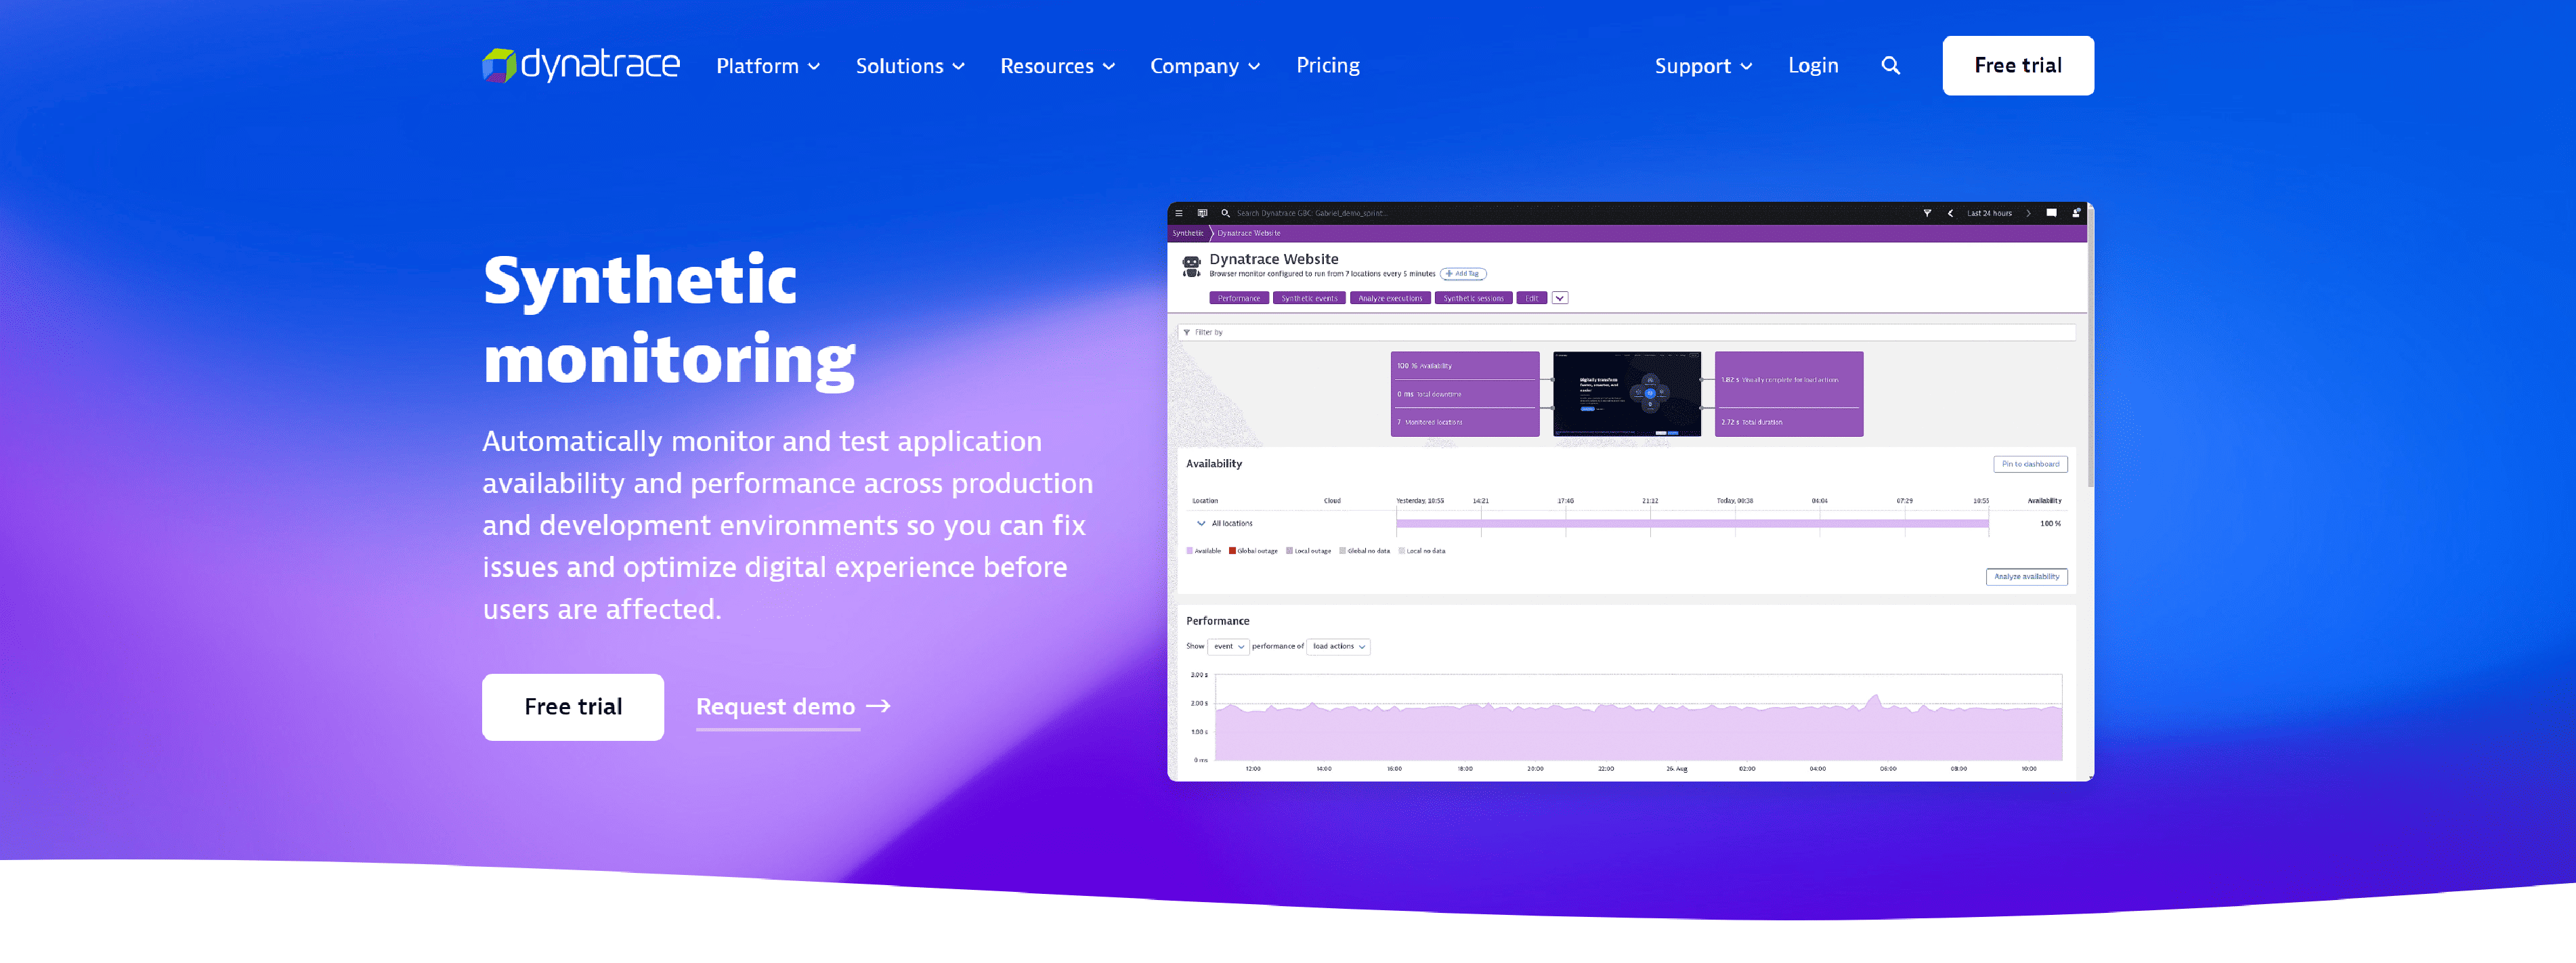
Dynatrace automatically monitors and tests application availability and performance across both production and development environments, allowing you to resolve issues and optimize the digital experience before users are impacted.
- Leverage a top-tier network with low latency, high throughput, and robust redundancy
- Simulate customer journeys across all major desktop and mobile browsers to ensure a consistent experience
- Continuously monitor the performance of key pages, APIs, and transactions from every location
- Run monitors from private locations to track the availability and performance of internal resources
- Monitor critical workflows without scripting by using an intuitive web-based recorder
- Playback scripted transactions to verify the accuracy of your tests
- Test business transactions from real browsers to simulate actual user behavior
- Optimize your performance with strategies used by industry leaders for superior results
- Benchmark your site’s performance against competitor pages and transactions in real time
- Compare application performance from the end-user perspective, using last-mile and mobile benchmarks
- Enhance quality through shift-left testing by running synthetic tests early and frequently
- Measure compliance with service-level objectives (SLOs) to assess if software versions should progress in the SDLC
- Automatically pinpoint the root cause of issues identified by synthetic tests during pre-production and production validation
Datadoghq
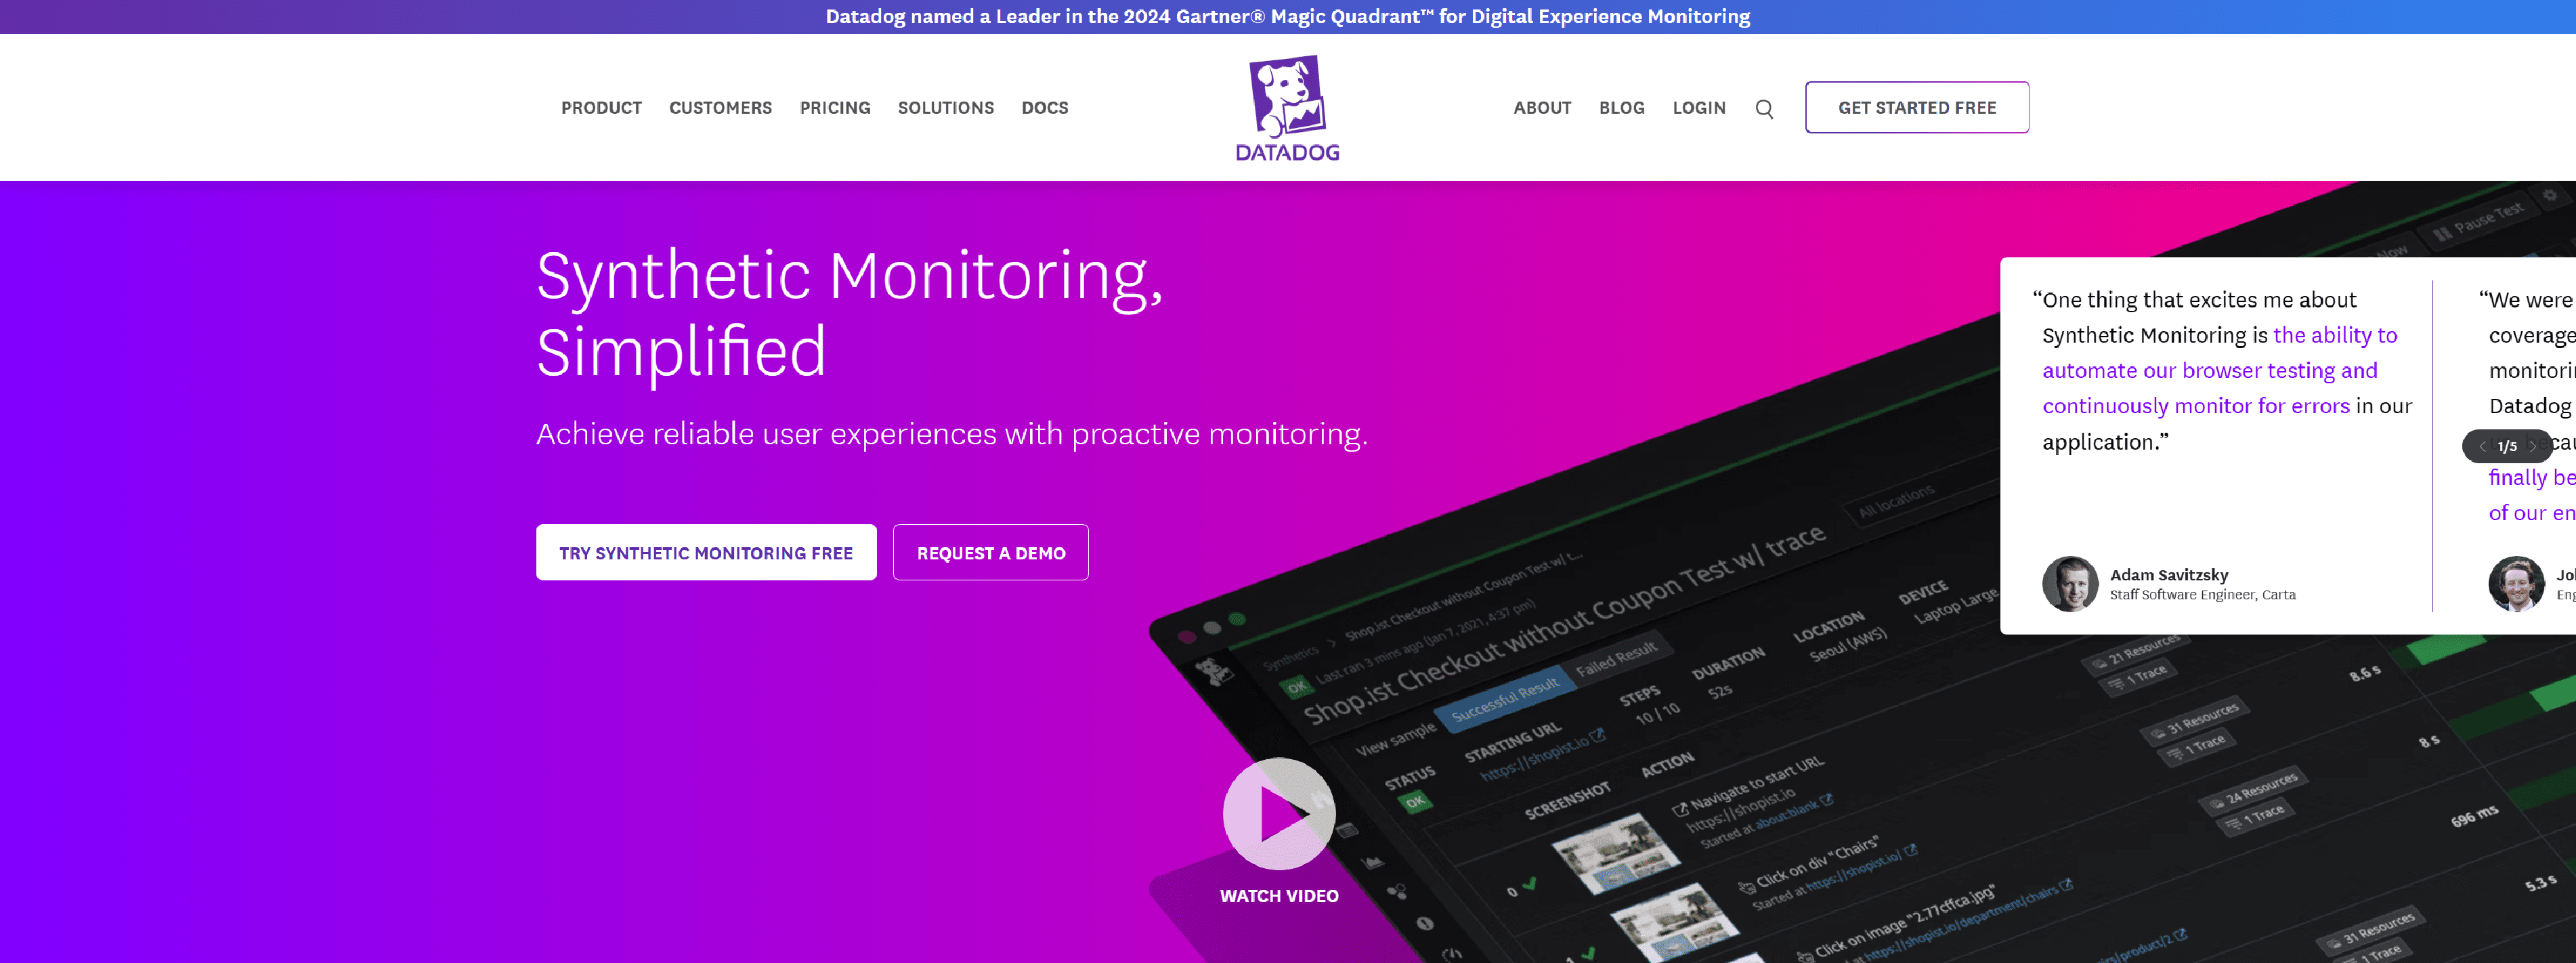
Datadog Synthetic Monitoring is a proactive solution that allows you to create code-free API, browser, and mobile tests to automatically simulate user flows and requests across your applications, key endpoints, and network layers.
- Access comprehensive context for troubleshooting failed tests without switching between tools, by leveraging Datadog APM and RUM integration, which correlates metrics, traces, logs, and session replays
- Track application uptime and performance alongside crucial business metrics, enabling you to monitor SLAs and SLOs effectively
- Gain deep visibility into your entire internet stack – including CDNs, SaaS APIs, cloud providers, and networks – to quickly identify issues and eliminate unnecessary troubleshooting cycles
- Integrate end-to-end tests into your CI pipelines for early detection, prevention, and remediation of issues across web and mobile applications. Use our integrations with popular CI providers like GitHub, GitLab, Jenkins, CircleCI, and Azure DevOps, as well as collaboration tools such as Slack and Jira, to streamline workflows and avoid context switching
- Facilitate collaboration by removing the need for separate testing scenarios, improving efficiency, release velocity, and business agility
- Evaluate your overall HTTP testing coverage with the Datadog API Catalog, and quickly create tests for any untested endpoints with a single click
- Identify frequently used untested web actions based on real user interactions, and create relevant tests to fill gaps in your browser testing coverage
- Boost testing efficiency and thoroughness with AI-Generated Synthetics, which uses intelligent algorithms to identify business-critical flows and create the appropriate tests within seconds through an intuitive chat UI
- Validate every layer of your systems (including HTTP, gRPC, SSL, DNS, WebSocket, TCP, UDP, and ICMP) from both global managed and private locations
- Quickly pinpoint the root cause with detailed network timing data for faster analysis
- Verify critical user flows at the API level by chaining API requests in multi-step tests
- Easily build tests with customized assertions using our fully hosted, codeless web recorder, and reduce false alarms with automatic detection of UI changes and test updates
- Visualize user flows step-by-step with screenshots and Session Replay, adding essential context with relevant network and performance metrics
Eginnovations
![]()
Eginnovations’ robotic checks run from any location and across any application to identify SLA issues, featuring protocol-level tests, browser simulations, pre-built logon simulators, and the ability to simulate both thick and thin client applications.
- Proactively tests and provides a detailed breakdown of response times to pinpoint bottlenecks
- Track performance over time and identify periods of performance decline
- Simulate performance from multiple locations for a comprehensive view
- Emulate real user interactions with websites from various locations, recording availability and end-to-end response times
- Identify slowdowns caused by specific transactions in web application/website interactions and deliver instant alerts for service outages and performance dips
- Support root-cause diagnosis and infrastructure optimization by correlating with other network, server, and application performance data
- Automate routine service health checks reliably
- Test from multiple endpoints across global and remote locations, comparing performance
- Support multiple applications per user for logon simulations
- Simulate logins from multiple users on the same endpoint
- Break down every step of the logon process – web access, authentication, application enumeration, desktop launch – to identify causes of slow logins
- Test any application from any location
- Collect accurate metrics on session performance and user experience, proactively identifying issues
- Playback tests from different global or remote endpoints to compare performance across locations
- Establish session performance benchmarks, which can be used as baselines for comparison with real user monitoring data
Elastic

Elastic allows you to monitor essential user journeys through its global testing infrastructure, providing full end-to-end visibility into website performance, functionality, and availability – from development to production – so you can identify issues before they affect your customers.
- Test user journeys to enhance the customer experience
- Improve the SRE experience
- Simplify the testing process from development to production using GitOps
- Enjoy synthetic monitoring with no maintenance required
- Speed up development and enhance your application code
- Make infrastructure monitoring easier at scale
- Efficiently deploy and manage logs at scale
- Track and measure end users to optimize your applications
Apica
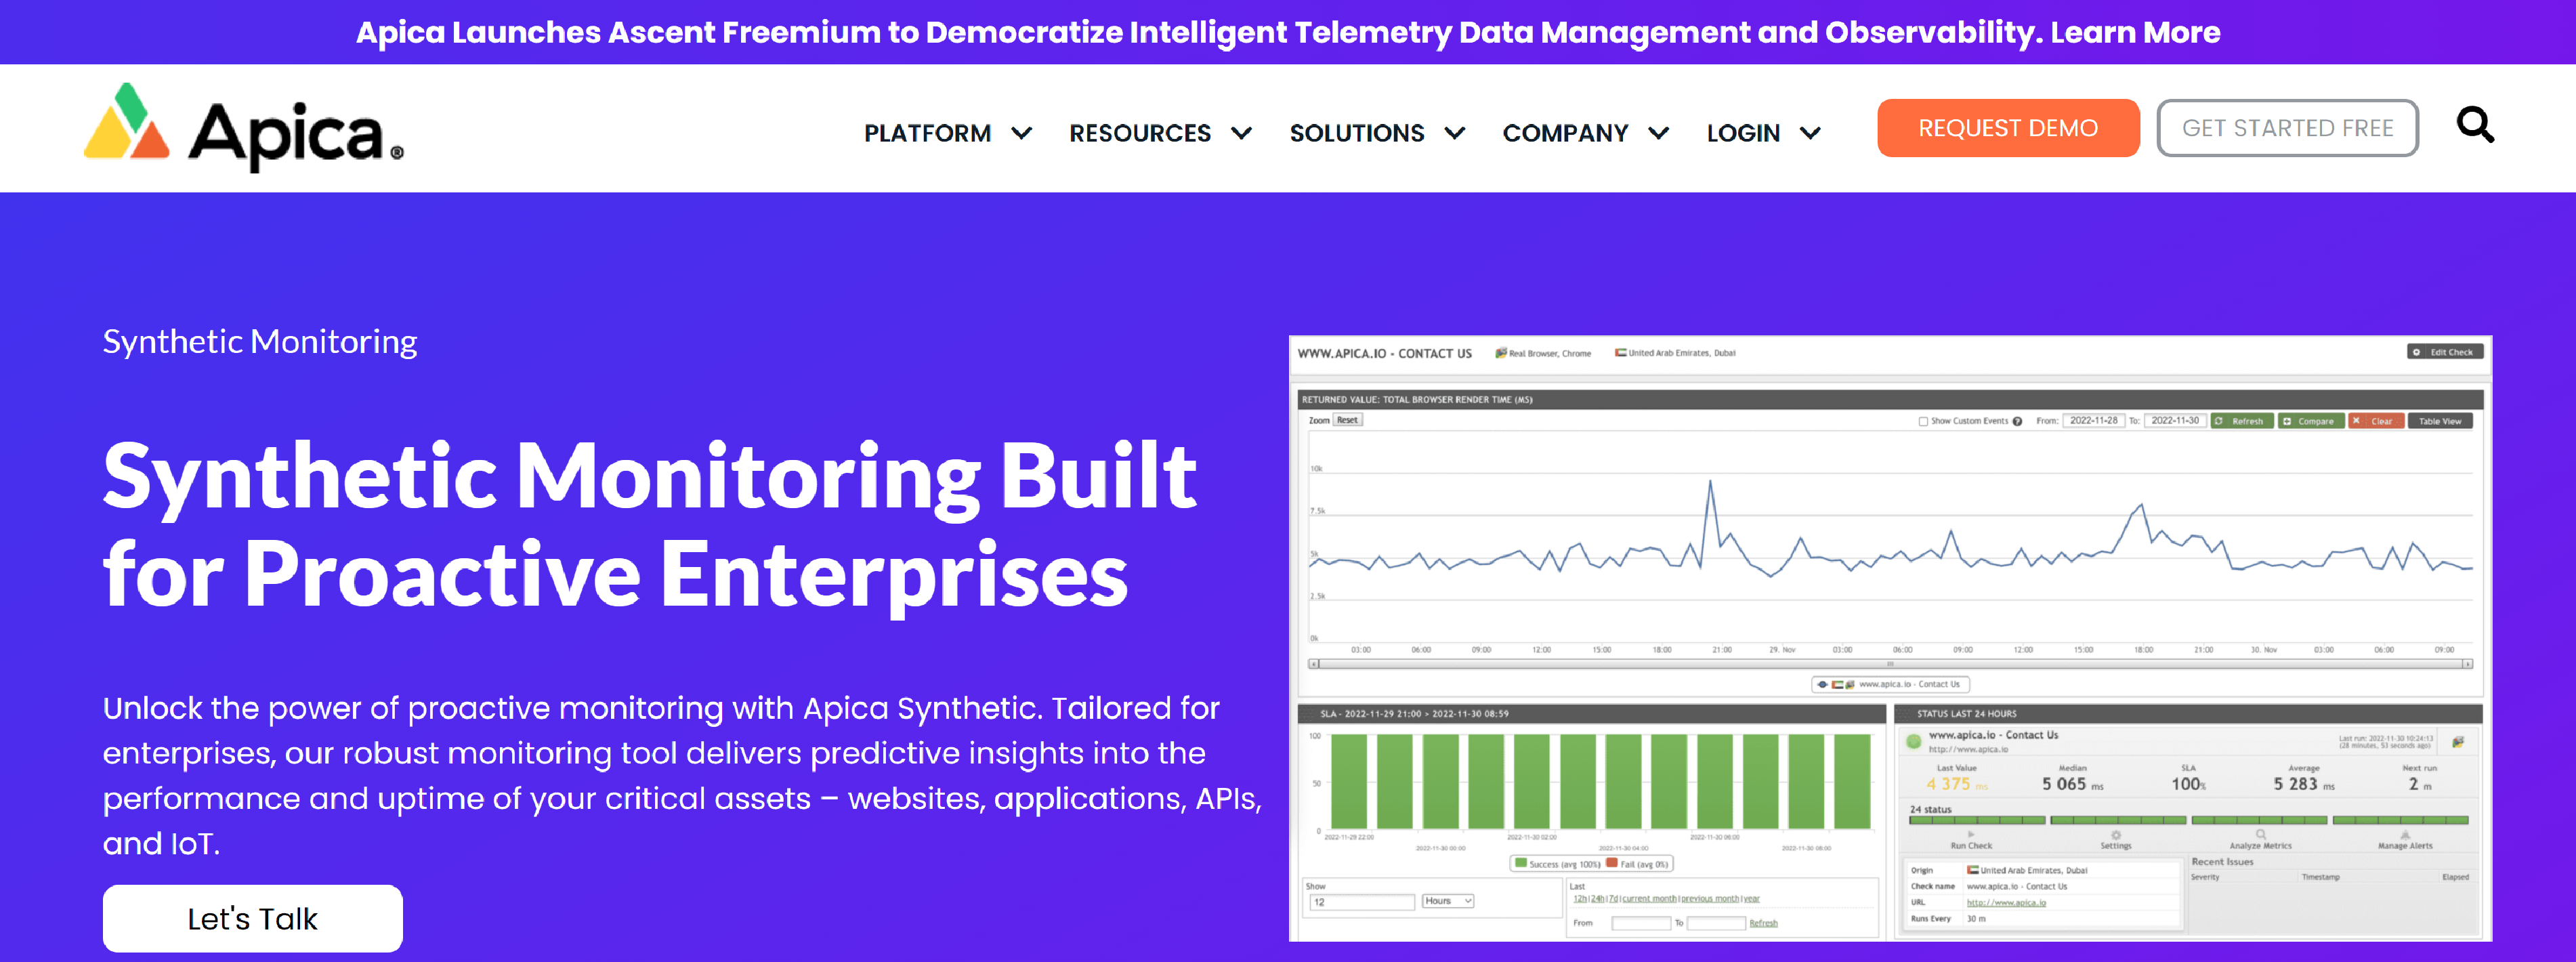
Unlock proactive monitoring with Apica Synthetic, a powerful tool designed for enterprises that provides predictive insights into the performance and uptime of your critical systems.
- Create intricate user journeys that simulate real business functions. Record, edit, and replay network traffic across apps and devices – all without writing code
- Detect issues proactively with APM and website performance monitoring
- Apica provides a scalable SaaS solution, with hybrid and on-prem deployment options, ensuring high security and availability
Pingdom
![]()
Pingdom – Simulate visitor interactions with your website, ensuring that you and your team are the first to detect if your site is slow, malfunctioning, or offline.
- Instantly Know When Your Website Goes Offline
- Enhance User Experience with Faster Load Times
- Address Critical Site Flow Issues Before They Impact Your Business
- Gain Performance Insights with the Pingdom API
- Track and Share Performance Against Service Level Objectives
Uptrends

Uptrends Synthetic Monitoring utilizes web browser emulation to replicate the actions users would take on your site.
- Simulate slower load times and bandwidth connections to evaluate how users can connect, no matter their speed
- Create a public status page to share your website’s status with the world
- Dive into the details or focus on a specific date range to analyze your website’s uptime and performance
- View error messages from the user’s perspective