Observability tools are software systems and platforms that help monitor, measure, and analyze the performance, health, and behavior of applications, systems, or infrastructure in real-time.
Discover the top 10 observability tools
Grafana
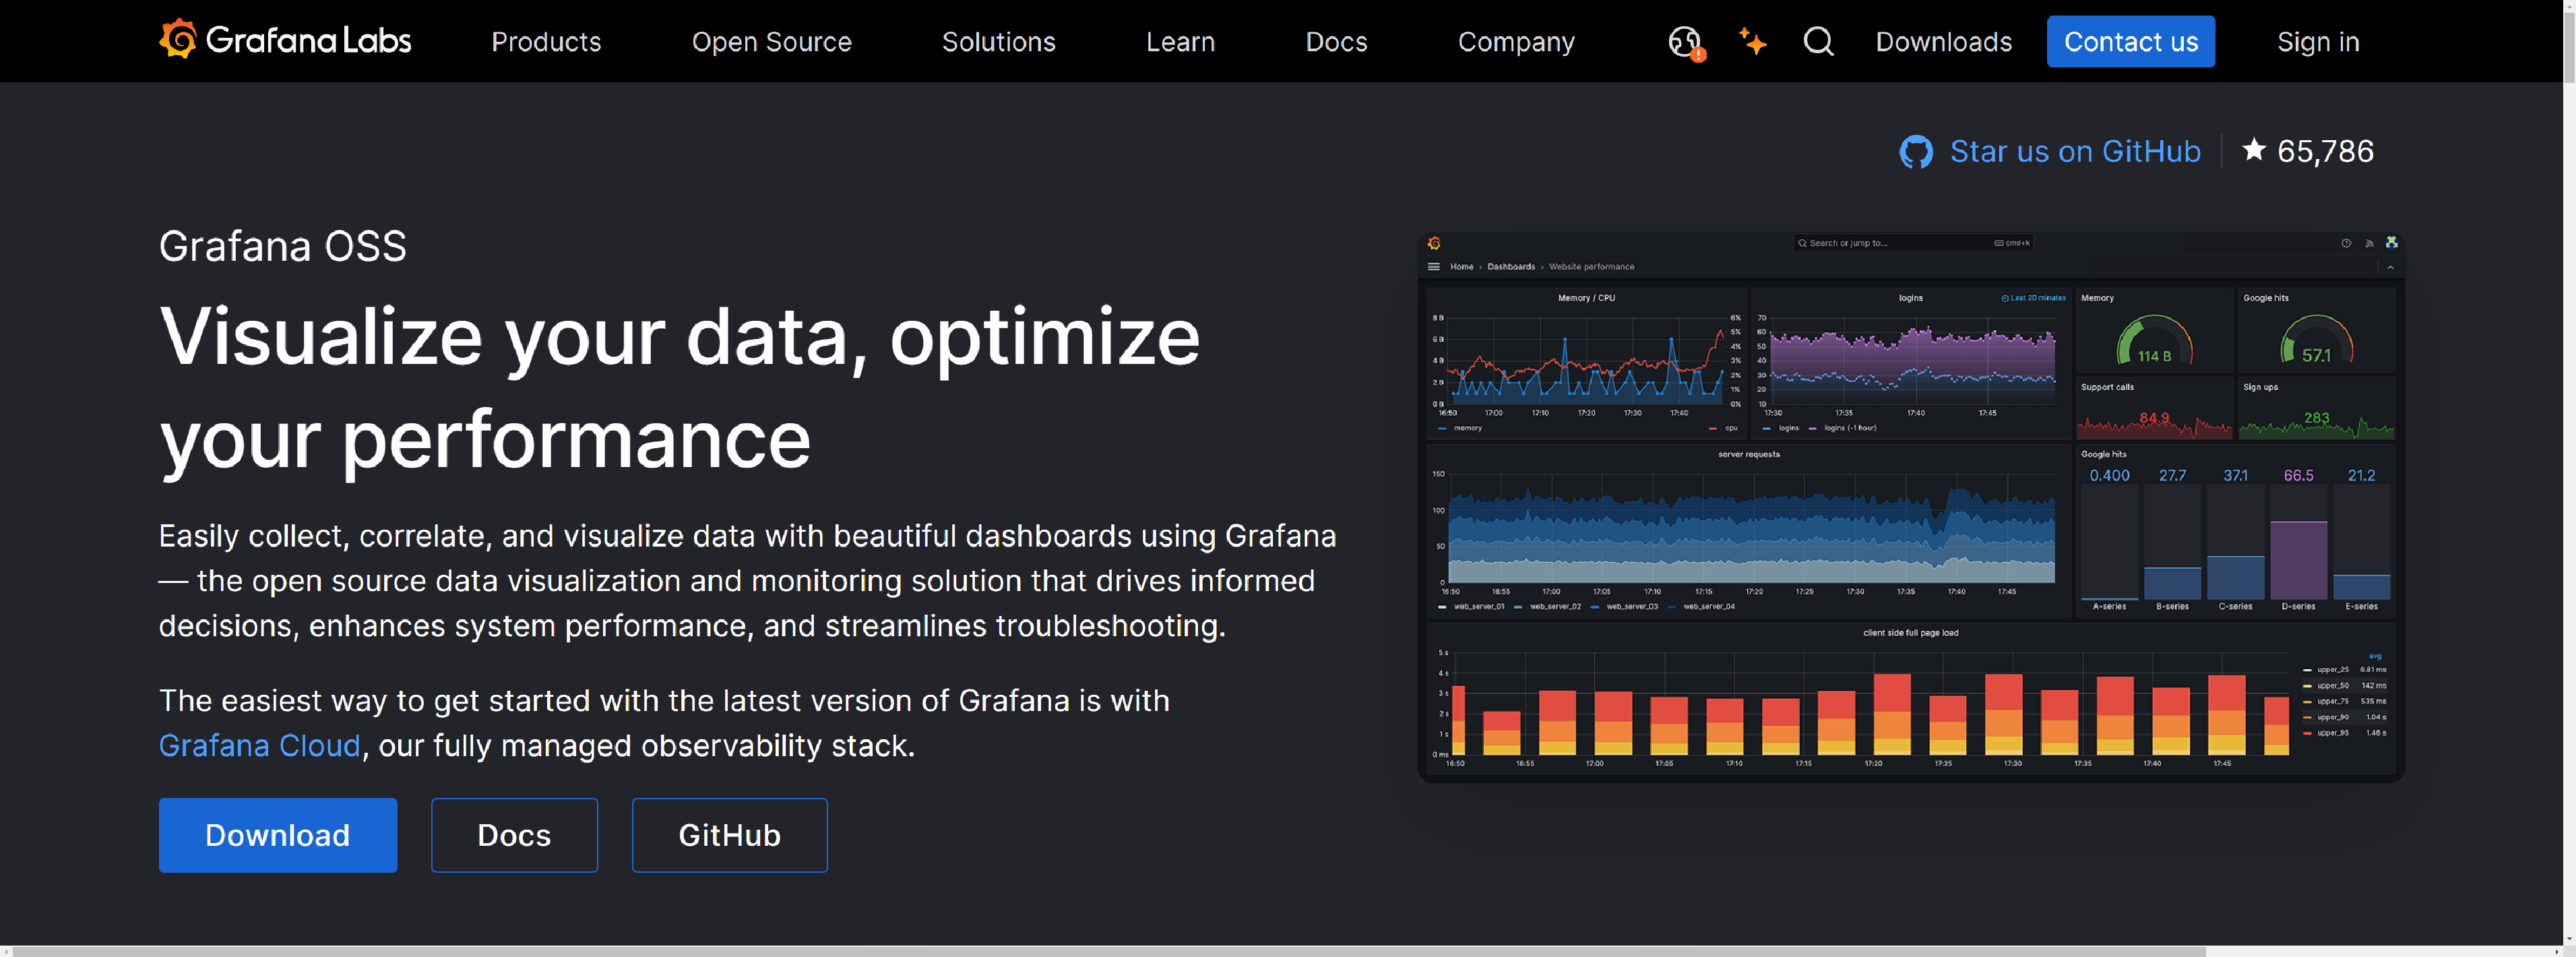
Improve operational efficiency, monitor your infrastructure, and analyze metrics, logs, and traces with Grafana, the leading open source tool for dashboards and visualizations.
- Grafana’s growing suite of visualizations, ranging from time series graphs to heatmaps to cutting-edge 3D charts, help you decode complex datasets
- With 150+ Grafana plugins, you can unify all your data sources into a single dashboard to streamline data monitoring and troubleshooting
- Alert on data from a wide variety of data sources to identify problems and fix them quickly
Newrelic
Newrelic – Gain deep AI-powered insights with a unified full-stack observability platform to uncover and fix errors and security issues faster from one place.
- Automatically understands all your growing systems and data
- Autonomously predicts and prevents issues and orchestrates operations
- Connects observability to business impact, providing intelligence for all
Elastic
Elastic Observability – the most widely deployed GenAI optimized observability solution. You get full stack visibility and actionable insights to go from real-time to proactive.
- Unify visibility across hybrid and multi-cloud
- Fast-track your move to the cloud
- Round-the-clock monitoring of digital experience
- Speed up innovation with faster releases
- Context-aware actionable insights with ML and AI
Dynatrace
Dynatrace – Turn data into answers, through intelligent observability by resolving problems rapidly, and delivering superior customer experience.
- Real-time topology mapping provides context across the full stack
- Causation-based AI delivers precise answers
- OpenTelemetry for better coverage
- Automation enables scalability
- Harness intelligent observability
Cloudzero
Cloudzero – Proactively manage cloud costs and drive meaningful business insights.
- Ingest any cloud, PaaS, and SaaS spend, including AWS, GCP, Azure, Snowflake, Kubernetes, and more
- Organize spend by any dimension you care about, including cost per customer, feature, and more
- Empower your engineers with relevant, timely cost data that lets them find optimizations only they can find
Observeinc

Observeinc – Fewer incidents, more features & happier customers.
- Open Data Collection
- Separate Compute and Storage
- Always Hot Data
- Schema-On-Demand
- Rich and Intuitive Language
- O11y AI
- Data Correlation and Acceleration
- Elastic Compute and Columnar Analytics
- Cost-efficient Cloud Object Storage
- Unified, Open Data Lake
Montecarlodata
Monte Carlo increases trust in data and AI by helping teams find and fix bad data, fast.
- Scale anomaly detection across your pipelines automatically
- Deploy deep quality monitors with +50 metrics
- Build custom rules for unique business logic
- Ensure consistency across tables and databases
- Enhance focus with automated impact analysis
- Get actionable alerts to the right team
- Track incident tickets, severity, and status
- Display data product SLAs and health status
Servicenow
Servicenow – Break down silos to resolve issues quickly across teams, integrate observability capabilities into your existing workflows for alerting and incident management.
- Help teams spend less time investigating and more time building
- Analyze system-wide data instantly to answer the questions that matter most
- Maintain vendor neutrality while maximizing coverage for visibility and observability
- Query your telemetry data with one tool across notebooks, dashboards, and alerts
- Integrate logging into core telemetry workflows alongside metrics and tracing data
- Know where issues exist, quantify their impact, and resolve them before they impact production
- Query and correlate metrics, logs, and traces on demand across your cloud-native ecosystem
- Automatically discover and map cloud-native apps, inferred services, and Kubernetes objects
Datadoghq
Datadoghq – Modern monitoring and security allows you to seamlessly analyze and correlate front and backend data.
- Modern monitoring for a complex world
- See everything in one observability platform
- Create context to gain actionable insights
Azure.microsoft
Gain end-to-end observability into your applications, infrastructure, and network both on cloud and hybrid environments with Azure Monitor.
- Get a customized monitoring experience on a particular service or set of services with minimal configuration
- Observe ingested data from your distributed environment on a single pane of glass
- Get deeper troubleshooting, diagnosis, and analysis on your telemetry data
- Get near-real-time alerts and ability to autoscale resources when load increases